Desktop Designers
Welcome to the dReveal Desktop Authoring Tools guide! In this tutorial, you'll learn how to leverage dReveal's powerful features to create and define reports that communicate insights effectively.
The dReveal authoring tools are Windows desktop applications designed to help users build a variety of report types: Grids, Dashboards, Documents, and Models. These tools offer flexibility, allowing you to choose the right visual representation, data sources, and configurations for each report type.
Key Features
With dReveal, you have control over every aspect of your reports—from selecting chart types to presenting datasets. This flexibility is ideal for data analysts, business professionals, or anyone handling data. dReveal’s user-friendly interface and robust set of tools make it easy to create visually compelling reports that engage end-users.
The Report Creation Process
The report creation process begins with the Model Designer—a critical first step. Here’s a breakdown of each designer and its purpose:
- Model Designer (dModelX): The Model Designer serves as the foundational step, where you define a data model that standardizes and organizes data. This model can then be used as a consistent base for creating Grid, Dashboard, and Document reports, ensuring a unified data structure across all report types.
- Grid Designer (dRepX): Build grid-based reports, focusing on tabular data. Customize columns, sorting, grouping, and more to create reports that emphasize detailed data views.
- Dashboard Designer (dDashX): Develop interactive dashboards with visual elements like charts and gauges, ideal for displaying KPIs and metrics.
- Document Designer (dDocX): Create paginated, print-ready reports perfect for formal documentation and sharing.
Each file type (dModelX, dRepX, dDashX, and dDocX) is generated by its respective designer, allowing for specialized customization while maintaining coherence through the shared model.
Using the dReveal Launcher
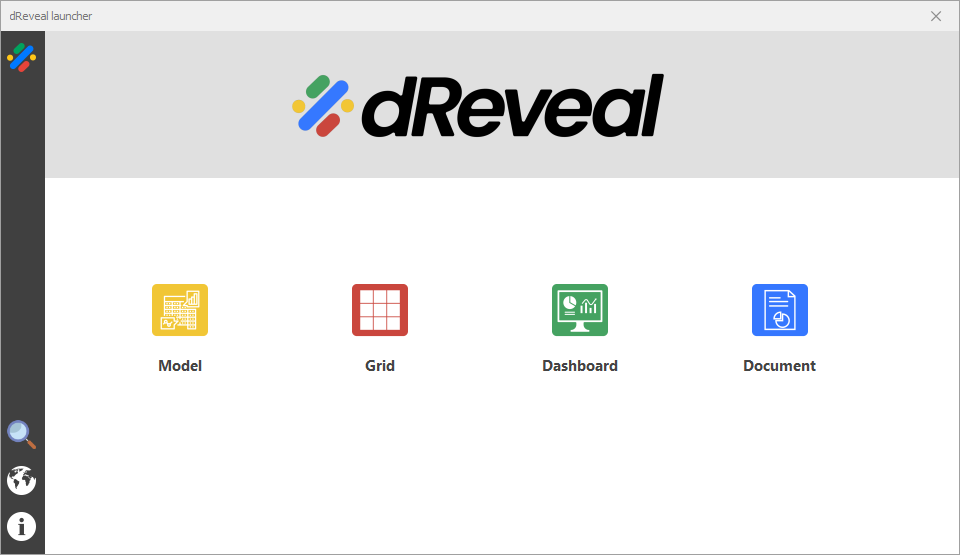
Below, you’ll see the dReveal Launcher interface, which acts as the command center for accessing all areas of the report-building tools. The launcher enables you to navigate between each designer, manage your models, and organize reports seamlessly.

Workflow Overview
The diagram below outlines the dReveal Desktop Designers workflow. Starting with the Model Designer, you’ll define a data model (dModelX) that serves as the basis for creating Grid, Dashboard, and Document reports. This model-driven approach simplifies updates and ensures data consistency across all reports. Notice the distinct file extensions for each report type, tailored to its respective designer.
In a nutshell, dReveal's desktop designers offer a dynamic duo: Model Designer for creating the core structure, and Grid, Dashboard or Document designer for putting that structure to amazing use. It's a seamless process that transforms data into valuable insights for your web application.
Ready to Start Building?
Now that you’re familiar with the structure and workflow of dReveal, let’s dive in and unleash the full power of data visualization with dReveal!
